Advanced Tissue Analysis via Spatial Transcriptomics at Nexco
And presenting a novel, powerful platform for Spatial Transcriptomics data collection, processing, analysis, and 2D/3D display
As we have covered already a few times because these techniques are at the core of Nexco’s expertise and most requested activities, single-cell RNA sequencing (scRNA-seq) and Spatial Transcriptomics (ST) stand as revolutionary tools in biology and medicine. This is so because they allow the exploration of cellular states at high resolution, providing unique descriptors essential to advance fundamental research in biology and to track disease-related markers for diagnosis.
In scRNA-seq, the RNA transcripts of individual cells are sequenced and quantified, providing a summary of gene expression levels within individual cells. Already over a decade ago, this technique transformed biological and biomedical research by enabling precise quantification and analysis of the transcriptome cell by cell, revealing insights into gene activity and expression dynamics across cells and within tissues, even possibly resolved in space and time depending on how samples are collected, for example from different portions of a tissue or at different times of a differentiation process.
As an analytical method, scRNA-seq catalyzed breakthroughs in understanding cellular mechanisms, disease pathology, and therapeutic targets. Despite its many strengths, traditional scRNA-seq falls short in providing the spatial resolution, as it cannot identify the physical location of RNA transcripts within the context of native tissues and any space information can only come from physical separation of the cells, for example from different samples of a tissue. A full, high-resolution spatial information, ideally in three dimensions, is however crucial for understanding cellular interactions and microenvironments more accurately, and to capture dynamics in full spacetime.
ST addresses this limitation by combining transcriptomic data with spatial context, enabling the mapping of RNA molecules within intact tissue sections. ST is typically performed by placing thin tissue slices onto grids of spatially indexed spots, each of which captures RNA from a specific location. The RNA from each location is extracted, amplified, and sequenced, allowing the gene expression of each spot to be mapped back to its precise spatial location in the tissue. This process generates high-resolution maps of gene activity, preserving the spatial architecture of the tissue and enabling the study of cellular interactions, tissue heterogeneity, and the organization of complex biological systems in situ.
ST allows scientists to explore gene expression across different cell types and microenvironments within the actual tissues, without having to physically separate any cells and actually being compatible with multiple spatially resolved studies as we covered in this example. Therefore, ST can reveal complex patterns and dynamics that remain just inaccessible with regular scRNA-seq; as a result, ST is again transforming fields ranging from tissue development and disease progression to drug discovery and biomarker identification.
How to do ST, exactly?
ST has been around for almost a decade, and began with a 2D version that has recently evolved into a 3D version. In the original 2D version of ST, tissue sections are placed on a slide or substrate that contains a grid of spatially indexed spots (often referred to as capture spots). These spots are arranged in a precise 2D grid pattern, and each spot corresponds to a specific location on the tissue. Each spot is typically covered with a series of short DNA probes that are complementary to poly-A tails or specific sequences for RNA capture. RNA from the tissue is then captured by these DNA spots, which are chemically linked to oligonucleotide barcodes, and then the RNA is sequenced to determine gene expression levels. Since each capture spot contains a unique barcode, we can then associate the RNA data back to the precise spatial location where it was captured in the tissue. The result is a gene expression profile for each spot, with spatial coordinates attached to it, producing a 2D map of gene expression in the tissue slice.
For 3D ST, tissue samples need to be prepared differently, but the overall idea is the same just adding height as the third dimension. One approach is to perform ST on multiple 2D slices of the same tissue, essentially stacking the slices and using spatial registration to map the gene expression data from each slice back into a 3D context. Alternatively, newer techniques combine 2D ST with microdissection or embedding in 3D matrices, allowing for more continuous 3D data acquisition.
Intensive computing, facilitated by numerous software, atlases, and methodologies that we master at Nexco
At Nexco, our bioinformatics services are designed to harness the full potential of these technologies, with a particular focus on integrating various analysis algorithms, packages, and programs for deep, cost-effective, and high-resolution spatial analysis. And, key, with over a decade of experience handling, processing and analyzing transcriptomics data.
We employ cutting-edge software solutions and sophisticated computational pipelines to process and interpret complex spatial transcriptomics data, providing our clients with detailed insights into tissue-specific gene expression patterns, cellular interactions, and the underlying biology of health and disease. By integrating these techniques with extensive biological atlases and curated data sets, we ensure accurate, high-quality results that contribute to advancing both basic research and clinical applications. Our expertise in spatial data analysis allows us to offer comprehensive insights into the dynamic interactions within tissues, making Nexco a leader in applying spatial transcriptomics to the forefront of biological discovery.
In the rest of this blog post we present a new software platform at the frontier of ST data analysis, from a very rich article full of examples published recently on Cell.
Open-ST: Advancing high-resolution ST
Open-ST is an open-source spatial transcriptomics method with efficient whole-transcriptome capture at sub-cellular resolution (reportedly as good as 0.6 μm, that is well sub-cellular) at low cost (<150€ library preparation per 12 mm²). It requires standard lab equipment and includes open-source software for seamless data processing and analysis. As its name suggests, Open-ST is an open-source maintained by the Rajewsky lab and made available in a GitHub repository that also includes the human and mouse datasets showcased in the publication describing the platform — raw data, instructions on how to reproduce the preprocessing pipeline, the corresponding preprocessed data, and ready-to-use notebooks for exploratory visualization and downstream analysis.
Open-ST is specifically designed to process and visualize high-resolution tissue gene expression data. It attempts on one hand to enhance the resolution of ST data mapped onto 2D and 3D spaces, and on the other hand to facilitate access to powerful ST analyses. In other words, Open-ST strives to combine the highest spatial precision with ease of use.
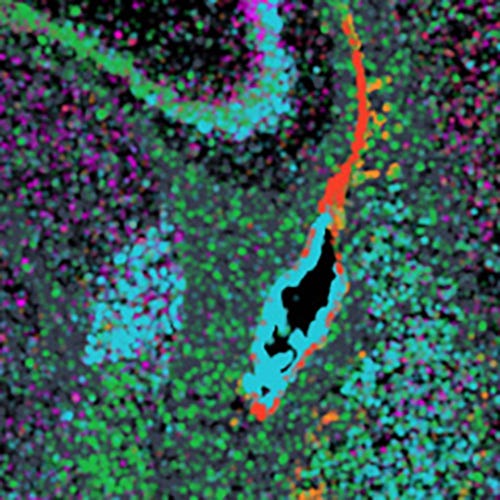
The suite leverages advanced computational techniques to not only map gene expression at specific tissue locations but also facilitate the creation of 3D tissue reconstructions by integrating 2D slices. In the highest-resolution examples provided in the paper that described Open-ST, Illumina flow cells were used to create dense barcoding and achieve a capture spot resolution of ~0.6 um using rather standard experimental setups. Note that at such high resolution, the transcript information can be mapped with enough precision to tell among different subcellular compartments, as exemplified throughout the article with individualization of transcript quantifications in for example nuclei and mitochondria.
For example, through an hematoxylin/eosin imaging pipeline optimized for fresh-frozen samples, Open-ST produces high-resolution images for cell segmentation based on nuclear size and aspect ratio, cellular density, or distance between cell centroids. Then, the molecular readouts from ST data can be mapped into the resulting segments, effectively achieving high sub-cellular resolution. For this to work properly, a few of Open-ST’s features are essential: automatic but robust cell segmentation, proper pairwise alignment of transcriptomic and imaging data to ensure accurate spatial mapping, and proper mapping of the quantified transcripts to the defined cells or regions in order to achieve in-depth gene expression profiling.
Then, Open-ST’s 3D reconstruction capabilities produce virtual 3D models of the tissues useful for biological interpretation of the data. On top of this, customizable Jupiter notebooks and interactive visualization tools allow selective display of the spatial arrangement of transcripts, cell types, and gene expression patterns in both 2D and 3D.
Example applications of ST from the Open-ST paper
ST is opening new frontiers in research and clinical practice, with highly relevant applications. For the analysis of tissue development and differentiation, ST provides detailed mapping of cell positions and interactions and it tracks how genes (de)activate along the differentiation/development pathway. Similarly, spatial profiling of gene expression can reveal tissue heterogeneity in diseases like cancer, useful to diagnose the pathology, track the effect of treatments, etc. Another interesting application is in evaluating the impact of drugs at different levels of resolution within tissues.
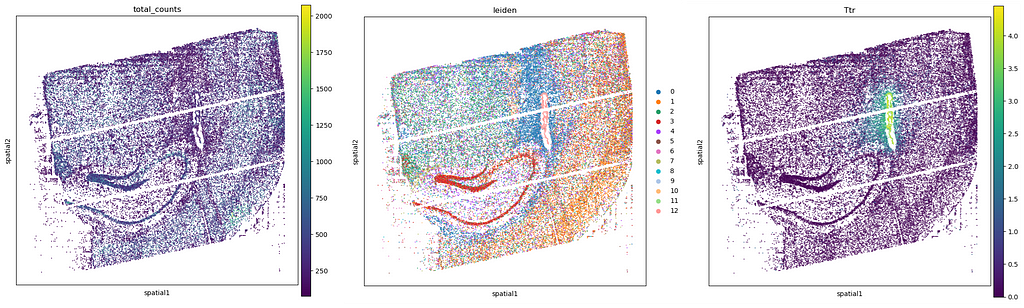
The paper reporting Open-ST presents three hand-on examples that users can also work with to reproduce the results shown in it. To start with, an adult mouse hippocampus sample is used to benchmark the precision, sensitivity, and spatial resolution of RNA capture against published gene expression data, and the possibility to maintain RNA quality by controlling sample handling and timing. Here are some example outputs from the Open-ST tutorial, showing (from left to right) total counts, Leiden clustering (recommended to segment regions with similar transcriptional profiles, helping to map tissue architecture), and the expression pattern of one specific gene:
To illustrate an example of 3D ST and a prototype application of Open-ST to cancer diagnosis, the system was used to construct a 3D virtual tissue block of a tumor lymph node from serial 350 μm thick sections containing over a million cells and 851 million transcripts. Open-ST recapitulated the transcriptomic identity of stromal, immune, and tumor cell types from the metastatic tissue, validated with an independent experiment. Sub-clustering identified 10 tumor cell subtypes present in both the primary and the metastatic tumor. These subtypes, spatially patterned in the primary tumor but not in the metastasis, included proliferative, inflammatory, keratinizing, and invasive phenotypes and correlated strongly to the spatial localization of cell-cell communication hotspots. Further analysis of the 3D virtual tissue blocks led to other discoveries, such as the identification of a spatially organized cholesterol biosynthesis signature and a population of macrophages at the 3D boundary between tumor and lymphoid tissue, which could work as potential biomarkers.
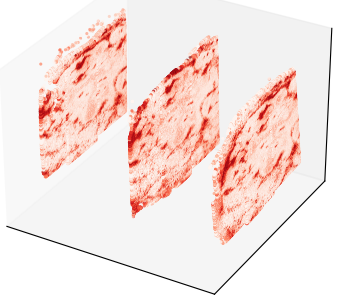
Here’s a stack of sections processed with Open-ST to show expression levels for one specific gene in 3D:
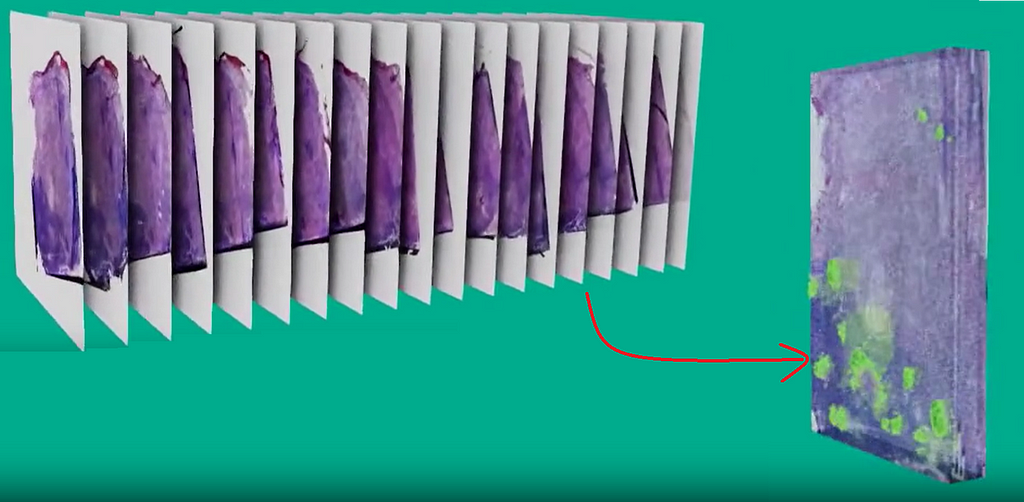
Then by stacking a larger number of sections one can better grasp the 3D shapes detected by the program:
Spatial Transcriptomics at Nexco
At Nexco we specialize in applying cutting-edge bioinformatics, including ST solutions, to empower you in your research and help you drive innovation. Our services are tailored to maximize the value of client data, providing comprehensive analysis from regular RNA-seq and scRNA-seq to advanced spatial profiling, along with various other advanced bioinformatics analyses that you can consult here.
For non-spatial datasets but extended to a wide range of transcriptomics and genomics inputs, don’t miss out our ONex tool for seamless end-to-end analyses, covering from data processing to the ultimate distillation of conclusions:
Discover ONex: our end-to-end solution for Omics analysis
Now, software like Open-ST help us to serve you better, by training you and/or running analyses for you as well as by consulting at different stages of your research program from experimental design through to the data analysis stages. At Nexco we bring all our expertise to apply various programs and methodologies, developing along the way what’s missing to be tailored to your specific problems, questions, and datasets. Thus clients benefit from personalized solutions but powered by well-established methods and software when available.
Key references and related reads
A recent review on single-cell and spatial transcriptomics on Nature Reviews in Molecular and Cellular Biology:
Application of advanced ST to cancer research, published this year in Molecular Cancer:
Advances in spatial transcriptomics and its applications in cancer research - PubMed
A concrete application of ST to understanding the tissue structure of glioblastomas, published this year in Cell:
Integrative spatial analysis reveals a multi-layered organization of glioblastoma - PubMed
Paper reporting the Open-ST software this year in Cell:
Open-ST: High-resolution spatial transcriptomics in 3D - PubMed
Open-ST at GitHub:
Our previous blog posts introducing Spatial Transcriptomics:
- What is Spatial Transcriptomics?
- Spatial Transcriptomic Data Analysis: A Beginner's Guide
- Unveiling the 3D Organization of Tissues Through Spatial Multi-Omics
Related Posts

Nos locaux:
Nexco Analytics Bâtiment Alanine Route de la Corniche 5B 1066 Epalinges, Switzerland
Appelez-nous
+41 76 509 73 73
Laissez-nous un message
contact@nexco.chN'hésitez pas à nous laisser un message
Nous nous ferons un plaisir de vous répondre et de trouver des solutions optimales à vos besoins.
© 2024 Nexco Analytics. All Rights Reserved.